
Part 2 of 3: The Data-Driven MARS Method for Selecting the Best Comparables: A Practical Use Case
Last month, in the first part of a three-part series, we told you about our new MARS (Multi-Attribute Ranked Search) method for identifying the best comparables. In a world where valuation experts’ access to such a significant volume of data is growing every day, new tools are necessary to analyze the vast amounts of data — and that’s where MARS comes in.
Valuators typically begin by searching a transaction database applying a series of individual filters. A number of candidate comparables is eventually produced, and the valuator determines which to use in the valuation. MARS expands this valid approach by simultaneously assessing more attributes that might be comparable. This is the essence of the MARS process.
While a resulting transaction might not be a perfect match with the subject, it may match on several of the attributes. It evaluates multiple attributes to find and score comparable transactions. It provides a data-driven analysis, rather than a qualitive “eyeball” analysis of the data. Instead of filtering on one or two criteria, MARS simultaneously assesses five attributes (industry, revenue, date, location, and business description).
The market approach is grounded in the principle of substitution: A rational buyer won’t pay more for an asset than the cost of acquiring a comparable alternative. In practice, however, this creates a paradox. Valuation reports often assert — implicitly or explicitly — that the subject company is unique and operates under unique circumstances, yet the market approach requires comparison to market data. A perfect match rarely exists.
As a result, the central question becomes not whether comparable data exists, but what is close enough. Determining comparability requires judgment to identify which characteristics truly matter and which differences can be reasonably adjusted for. Working with imperfect data is precisely what valuation professionals are paid to do. Business valuation, at its core, is the disciplined process of explaining why data that’s “close enough” is sufficiently reliable to support a well-reasoned conclusion of value.
Figure 1: MARS User Interface example – The interface allows input of the five attributes and displays a scored list of comparable sales.
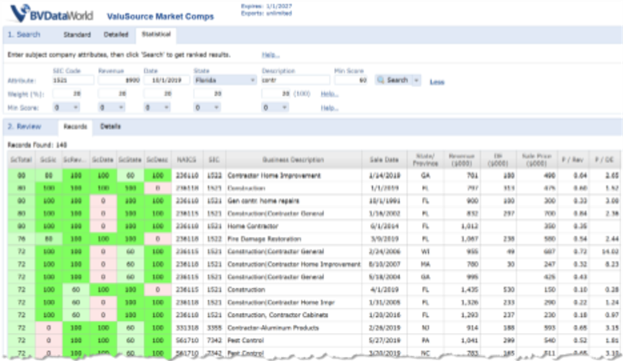
Although MARS was designed for ValuSource Market Comps, you can easily replicate the math in Excel.
To illustrate how MARS adds value, we’ll walk you through a hypothetical case and compare outcomes between a traditional search and a search enhanced with the MARS method.
MARS at Work – Traditional Approach
Let’s say the subject company is a small manufacturing firm in Colorado, with $750,000 in revenue in the last fiscal year. The business description highlights that it’s a “precision metal parts manufacturer serving the aerospace and automotive industries.” The valuation date is June 2025.
In a typical search, you’d use an SIC code and/or the industry description to come up with transactions and then manually evaluate them for comparability. If, for example, you enter 3599 as the SIC code and put “machine” as the description, you should return about 68 records. Using only the industry as a search parameter, revenue would be all over the board, location would be across North America, and some of the sales dates could be quite old.
The MARS Approach
The MARS method can return more results because it employs more attributes than simply SIC code and description. In this scenario, you begin by entering the subject’s five attributes into MARS and leave the default attribute weights at 20%, so each attribute is equally weighted. You also decide to start with a broad search — no minimum attribute score filters (all set to 0) — and a threshold Record Score of 50 (out of 100) to retrieve comparables that are at least moderately similar overall.
MARS scans the entire transactions database, which could include more than 50,000 deals across all industries and regions. Each potential transaction is scored on each attribute as follows:
- A sale involving a business in the same SIC code receives an Industry score of 100, while one in a related industry might score 80.
- A company with $825,000 revenue would receive a very high Revenue score (100 because it’s within a factor range), but a company with $1.2 million revenue would receive a lower score (60, indicating it’s larger than the target but not wildly so).
- A transaction from June 2025 (exact timing) scores 100 on Valuation Date; one in early 2024 would score around 80.
- Colorado sales score 100 on state, and those in nearby states (for example, any state in the Mountain or West regions) score about 60. Those in completely different regions would score 0 on state.
- Transactions involving companies whose descriptions contain “precision machining” or similar terms score high on description (100 if it’s a clear direct match in operations), and those involving businesses whose descriptions don’t mention similar keywords score lower.
After scoring all records, MARS produces a sorted list of transactions with their Record Scores. The highest scores are listed at the top.
For purposes of our scenario, the results include:
- Transaction A: Score 100 — A machine shop in Colorado sold in 2024 with $720,000 revenue. It’s an excellent match on all five attributes.
- Transaction B: Score 92 — A machine shop in Arizona (neighboring state) sold in late 2025 with $780,000 revenue. It’s a solid match on revenue and date, very good on industry, and good on description. It scores slightly lower on state because it occurred out-of-state but still within the desired region.
- Transaction C: Score 88 — A precision turned products manufacturer in Colorado sold in 2023 with $750,000 revenue. The industry score is slightly lower because the SIC is a cousin category, and the date score isn’t perfect because the sale was a bit older than desired. But it’s perfect on revenue and state, and the description is similar enough to receive a decent score.
- Transaction D: Score 84 — A larger machine shop in Arizona ($1.2 million revenue) sold in 2025. The industry, date, and the description matches. The revenue score is somewhat lower due to the revenue difference, and the state is adjacent but overall the transaction rings in above the 50 Record Score cutoff.
- Transaction E: Score 68 — A machine shop in Illinois sold in 2024. The industry, size, and date are very close, but the state score is 0 because Illinois is not in the same region. However, the other factors are strong enough to yield a score that suggests a review of the transaction.
In total, MARS returns a total of 161 transactions scoring 50 or above.
Assessing these results, you determine that transactions A, B, and D are very much in line with what you’d consider comparables. In fact, A, B, and D correspond to transactions you found manually. It’s left to your professional judgment whether the remaining results represent useful data points given the similarities (and dissimilarities) in attributes, as well as other information unknown to MARS. Of course, professional judgement must be used in determining which transactions remain in the sample.
The MARS Difference
This scenario illustrates how MARS can improve your efficiency. The manual search yielded 68 potential comparables. MARS surfaced 161 candidates with just one comprehensive search. Such a larger sample would provide a more credible, data-driven result, and you were able to consider more relevant data points without needing to make multiple, iterative inquiries. The entire database is analyzed in a single pass to produce a scored list. That means you can focus your time on analyzing the top results, rather than hunting for them.
Moreover, the MARS results are replicable, data-driven, and transparent — you can see how the scores are derived and recalculate them, increasing their credibility. How you then use the scores is based on your expertise.
Now, the caveat is that the MARS results in our scenario could include sales of, for example, a sushi restaurant and a dry cleaner. The industries aren’t remotely similar to the subject, but they may nonetheless be relevant because they match on revenue, state, and sale date. However, the MARS approach allows you to force SIC/NAICS codes to match exactly, which eliminates this issue. The expert must decide which results represent an equally desirable substitute. Some analysts will stick to traditional methods and say if it isn’t the same industry, it isn’t comparable. Other analysts will say, based on judgment and not data, that an equally desirable transaction will provide other attributes the traditional method rejects. It’s up to the expert to apply judgment to explain why these transactions are comparable, and, with MARS, it’s easy to justify that conclusion based on data.
Stay Tuned
In next month’s issue, we’ll conclude our MARS series by addressing some of the questions valuation experts might have about incorporating MARS into their established processes. And we’ll discuss scenarios that we think are especially ripe for MARS — as well as some that aren’t.